
Grantee Research Project Results
2012 Progress Report: Protecting Drinking Water by Reducing Uncertainties Associated with Geologic Carbon Sequestration in Deep Saline Aquifers
EPA Grant Number: R834382Title: Protecting Drinking Water by Reducing Uncertainties Associated with Geologic Carbon Sequestration in Deep Saline Aquifers
Investigators: Roy, William R. , Benson, Sally M. , Berger, Peter , Lin, Yu-Feng Forrest , Mehnert, Edward , Panno, Samuel V. , Ray, Chittaranjan , Butler, Shane K , Strandli, Christin , Yoksoulian, Lois
Current Investigators: Roy, William R. , Storsved, Brynne A , Hackley, Keith C , Lin, Yu-Feng Forrest , Rice, Richard J , Butler, Shane K , Benson, Sally M. , Kelly, Walton R , Freiburg, Jared T , Panno, Samuel V. , Ray, Chittaranjan , Strandli, Christin , Mehnert, Edward , Krothe, J. , Yoksoulian, Lois , D'Alessio, Matteo , Krothe, N.C. , Adams, Nathaniel , Berger, Peter , Askari-Khorasgani, Zohreh
Institution: University of Illinois Urbana-Champaign , Stanford University , University of Hawaii at Honolulu
Current Institution: University of Illinois Urbana-Champaign , Hydrogeology, Inc. , Illinois State Geological Survey , Illinois State Water Survey , Isotech Laboratories , Stanford University , University of Hawaii at Honolulu
EPA Project Officer: Aja, Hayley
Project Period: November 16, 2009 through November 15, 2014
Project Period Covered by this Report: November 16, 2011 through November 15,2012
Project Amount: $897,225
RFA: Integrated Design, Modeling, and Monitoring of Geologic Sequestration of Anthropogenic Carbon Dioxide to Safeguard Sources of Drinking Water (2009) RFA Text | Recipients Lists
Research Category: Drinking Water , Water
Objective:
Task 1: Monitoring at Natural Gas Storage Sites (Technical Leader: E. Mehnert, ISGS)
Task 4: Geochemical Investigations (Technical Leader: W. Roy)
Progress Summary:
Task 1: Monitoring at Natural Gas Storage Sites (Technical Leader: E. Mehnert, ISGS)
We continued to compile available geologic and limited operational data from ISGS records, the literature, the Illinois Commerce Commission (ICC), and natural gas storage companies. These data have been summarized in a 20-page document that we call the “Almanac,” which includes data for 18 sites—active, abandoned, and tested storage projects. During the past year, we reviewed and compiled data from gas storage company files for these fields—Tuscola (Douglas and Champaign Cos.), Hudson (McLean Co.), Lake Bloomington (McLean Co.), Lexington (McLean Co.), and Pontiac (Livingston Co.). We compiled a great deal of porosity and permeability data (4,043 values) from cores collected at these sites (Table 1). Most cores were collected from the Mt. Simon, but some cores also were collected in an overlying sandstone (Elmhurst), the caprock (Eau Claire) and an overlying aquifer (Galesville).
Table 1. Summary of core porosity and permeability data compiled in 2012. A total of 4,043 samples were tested using standard laboratory techniques.
|
Gas storage field | # of samples | Porosity (%) | Vertical Permeability (mD) | Horizontal Permeability (mD) | ||||||
| low | high | median | Low | high | median | low | high | median | ||
| Hudson/ Mt. Simon | 730 | 0.8 | 23.4 | 11.5 | <0.1 | 262 | 13.7 | <0.1 | 618 | 21.8 |
| Hudson/ Elmhurst | 245 | 0.7 | 13.5 | 4.6 | <0.001 | 0.7 | <0.001 | NM | NM | NM |
| Hudson/ Eau Claire | 323 | 1.0 | 11.6 | 3.9 | <0.001 | 0.008 | <0.001 | NM* | NM | NM |
| Lake Bloomington/ Mt. Simon |
611 |
0.6 |
21.0 |
11.3 |
<0.1 |
385 |
10.2 |
0.10 |
1125 |
20.6 |
| Lake Bloomington/ Elmhurst |
26 |
3.3 |
17.1 |
10.3 |
<0.1 |
29 |
3.1 |
<0.1 |
78 |
7.6 |
| Lexington/ Mt. Simon |
573 |
1.8 |
18.7 |
10.8 |
<0.1 |
440 |
12.6 |
<0.1 |
324 |
23.1 |
| Pontiac/ Mt. Simon | 768 | 2.2 | 17.7 | 9.7 | <0.1 | 183 | 2.0 | <0.1 | 775 | 4.9 |
| Pontiac/ Elmhurst | 7 | 5.4 | 11.6 | 8.7 | <0.1 | 11.6 | <0.10 | <0.1 | 1.2 | <0.10 |
| Tuscola/ Mt. Simon | 716 | 0.2 | 16.1 | 7.3 | <0.1 | 37.2 | 1.15 | <0.1 | 606 | 6.5 |
| Tuscola/ Eau Claire | 44 | 1.2 | 7.4 | 2.9 | <1e-06 | 0.378 | <1e-06 | NM* | NM | NM |
* NM= not measured
Table 2. Summary of aquifer testing in the Mt. Simon Sandstone
| Gas storage field | Duration of aquifer test (days) | Pumping rate (gpm) | Hydraulic conductivity (cm/sec) | Aquifer storativity (--) | Formations monitored | ||
|
Mt. Simon | Eau Claire |
Galesville | |||||
| Hudson | 19 | 55 | 8.7e-05 - 2.5e-04 | 9.1e-06 - 5.8e-05 | x | x | x |
| Lake Bloomington | 8 | 84 | 3.3e-04 - 4.3e-04 | 3.3e-05 - 8.6e-06 | x | x | x |
| Lexington | 2 | 10 | 6.1e-04 - 1.5e-03 | 2.1e-05 - 6.2e-05 | x |
| x |
| Pontiac | 41 | 45 | 1.0e-04 - 7.1e-04 | 1.7e-05 - 6.6e-05 | x |
|
|
| Tuscola | 50 | 105 | 2.2e-04 - 2.8e-04 | 3.9e-03 - 4.5e-02 | x | x | |
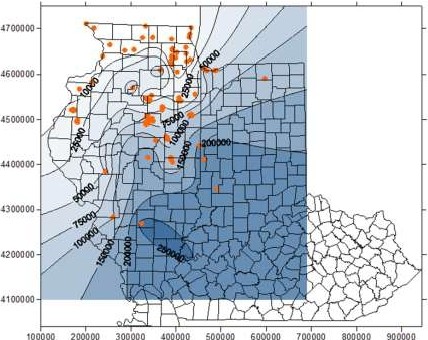
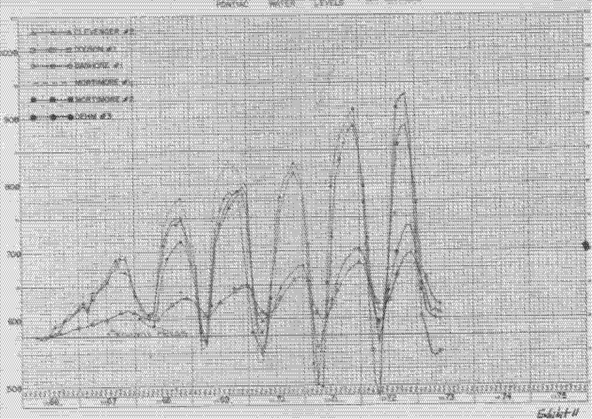
In addition, we compiled and analyzed aquifer test data from five sites (Table 2). The analytical results reported in Table 2 were determined using the Theis (1935) method. Additional methods also were used. We also compiled total dissolved solids (TDS) data and are developing a new salinity map for the Mt. Simon based on these data (Figure 1). This map will be useful as an initial condition for the basin-scale GCS model, as it represents the best available data for the location of the 10,000 mg/L TDS line (brine-freshwater boundary) within the Mt. Simon. We were not able to find any monitoring wells at gas storage fields suitable to monitor, so funds for that effort were shifted to fund project personnel involved with Task 4. The final subtask involves analyzing the water level response to the seasonal injection/withdrawal of natural gas. We identified suitable data from the Pontiac field (see Figure 2) that can be used for this wholefield analysis.
Task 2: Vertical Pressure Profiles for Monitoring CO2 and Brine Migration: Research and Validation of the Westbay System (Technical Leader: S. Benson)
Based on TOUGH2/ECO2N simulation results for synthetic cases, we found last year that by normalizing the pressure buildup in each monitoring zone to the pressure buildup at the depth of injection and by normalizing vertical pressure gradients to initial hydrostatic conditions, characteristic features in the pressure response can be obtained that are diagnostic of the CO2 plume height. This year, we applied these normalization methods to the IBDP multilevel pressure data. The results are good; the IBDP multilevel pressure data alone are indicative of the height of the CO2 plume (consistent with results obtained from RST [Reservoir Saturation Tool]) analyses and fluid sampling. As long as there is a monitoring zone at the depth of injection zone (or in the injection zone) and there are monitoring zones in the storage reservoir above, diagnostics can be obtained from multilevel pressure measurements that are useful for tracking the height of the CO2 plume real-time; prior to the CO2 plume arriving at the monitoring well.
From the simulation results for synthetic cases, we find that for a layered system, vertical pressure gradients calculated between closely spaced monitoring zones provide more information on the layered heterogeneity than do vertical pressure gradients calculated for monitoring zones that are farther apart (as expected). Monitoring zones that are farther apart will still provide useful information on the height of the CO2 plume, but in terms of constraining a geologic model, more details on the heterogeneity will be helpful.
As mentioned in the 2011 annual report, we have conducted simulations for both water injection and CO2 injection in order to separate out the effects of CO2 plume migration as opposed to the effects of the geologic structure of the system. At early times, water injection and CO2 injection give rise to (nearly) identical pressure responses for each geologic scenario, but are different for different geologic scenarios, indicating that the early response is caused by the geologic structure of the system. This year’s efforts have largely been concentrated on how to utilize this information. Inspired by recent work by Prof. Jef Caers and the Stanford Center for Reservoir Forecasting (SCRF) (e.g., Caers, 2011), we have decided to generate several plausible geologic scenarios along with a large number of realizations for each scenario. Scenarios that appear geologically plausible based on the static data but give rise to early-time pressure responses that are clearly inconsistent with the early-time observed (true) pressures, will be rejected prior to conducting any inverse modeling. Currently, we are in the process of separating out the earlytime response so that a large number of (fast) water injection simulations can be run for this early time and hopefully provide information that will restrict the number of plausible geologic scenarios to be used for CO2 injection simulations and inverse modeling.
Based on cross plots of gamma ray and porosity for both the IBDP injection well and the IBDP monitoring well, we have made a preliminary facies identification that, in combination with knowledge of the regional geology, will be used to generate plausible geologic scenarios representative for the IBDP site.
Task 3: Enhancement of Regional Flow and Transport Models to Reduce Risk (Technical Leaders: Y.-F. Lin, Illinois State Water Survey and C. Ray, University of Hawaii)
A basic conceptual model of the Mt. Simon system has been developed into a computational mesh for use with TOUGH2 (PC version). More realistic initial conditions of pressure, temperature, and salt concentration currently are being developed. Preliminary results from simulations using the current mesh and initial conditions have been used to develop boundary conditions for the SEAWAT model. Several scripts have been written in the Python programming language to convert results from TOUGH2 simulations into boundary conditions for SEAWAT simulations.
Scripts to convert SEAWAT results back into boundary conditions for TOUGH2 currently are being developed. A SEAWAT model based on the deep bedrock portion of the Fox River model of the Illinois State Water Survey (Meyer, et al., 2012) has been developed. Chicago area pumping records as well as predictions for future pumping rates are being used in this SEAWAT model. Initial conditions were obtained from the steady state version of the Fox River model.
When the initial conditions for both models as well as the mesh for the TOUGH2 model have been fully developed, linking the two will be automated by a single Python script. Regarding the relative permeability and the capillary pressure functions in the TOUGH model, Drs. Mehnert, Ray and Matteo D’Alessio (University of Hawai’i PhD student) continue to compile literature reviews on these topics:
- Mercury injection capillarity pressure testing—utility and application.
- Relative permeability, saturation and capillary pressure models—background and how to convert between Brooks-Corey and van Genuchten models.
- Compilation of van Genuchten model parameters for sandstones. We have found nine papers that have used the van Genuchten model to estimate parameters for sandstones.
- Parameters for the Berea sandstone and Hygiene sandstone have been estimated by several authors.
We have verified that the van Genuchten (1980) model is simply a curve fitting method. Although it was developed to fit properties of surficial soils, it makes no assumptions about soils that would preclude its use with rock or any other porous material. The information from these literature reviews will improve input data selection for basin-scale TOUGH2-MP modeling.
Task 4: Geochemical Investigations (Technical Leader: W. Roy)
During the third year, the Mt. Simon Sandstone experiments were completed. After exposure to the acidified brine for 6 months, the samples showed very little physical change in macroscopic scale other than a subtle color change in the coarser-grained material. We observed decreased amounts of clay surrounding quartz grains in petrographic samples (Fig. 1). XRD analyses indicated little change in bulk mineral composition in the post-reaction samples. Although inconclusive because of limitations of quantification (it is difficult to identify small volumes of clay minerals in the quartz dominated sandstone with XRD), from bulk-clay mineral XRD traces, it appeared that illite k-alpha peaks were more intense in pre-reaction samples and expandable clay peaks were less intense in post-reaction samples; qualitative SEM-EDX observations supported that some type of illitization took place. The chemical composition of the post-reaction brines indicated no significant change in composition. Petrographic and geochemical observations suggest that the low level of chemical reactivity of the Mt. Simon Sandstone and increased porosity enhanced by clay-mineral dissolution may increase its capacity to accept CO2.
Emphasis was given to experiments with the Eau Claire Shale during the third year. A kinetic experiment was conducted with three slices collected from four plugs of the Eau Claire from the IBDP CCS #1 core. Each set of slices was exposed to supercritical carbon dioxide at 316ºK (43ºC) and 16.8 MPa (2,430 psig) pressure for 3, 6, and 9 months. The 3-, 6-, and 9-month postreaction samples all had an increased friability and significant color change (from dark grey to rust red color) on surfaces exposed to the acidified brine and in macroscopic scale. Because of the opaque nature of shale in transmitted light, analyses performed using polarizing light microscopy were limited to observations of grain size and sedimentary structure. The 3-month samples analyzed by SEM-EDS had weathered illite and mixed clay, potassium feldspar, biotite, and pyrite crystals. The 6- and 9-month experimental samples both had continued weathering and degradation and areas where feldspar, biotite, and pyrite crystals preferentially dissolved from the clay matrix. Bulk and clay mineral XRD traces of pre- and post-reaction 3-, 6-, and 9-month experiments detected little change in composition. It should be noted that 6-month pre- and post-reaction results had a significant change in clay percentage of illite and chlorite, and the intensity of the chlorite and illite peaks diminished as the experimental duration increased. There was an increase in the 3- and 6-month post-reaction brines of Ca, Mg, Si, and K and a decrease in S in the 6-month experiments relative to the 3-month experiments. The 9-month fluid analyses have not been completed.
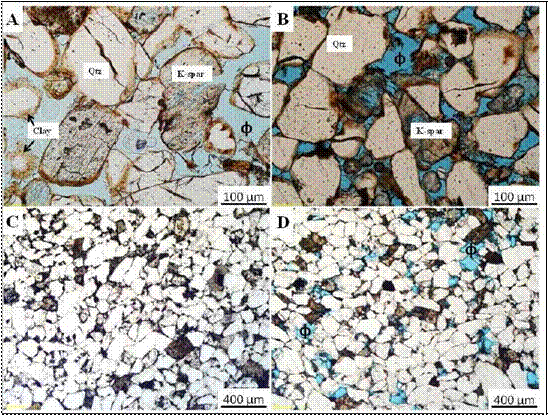
Figure 1: Pre (A, C) and post-reaction (C, D) photomicrographs of Mt. Simon Sandstone. Note the decrease in thickness
of clay lining around quartz crystals from image A to B. Image D shows an average porosity increase of 6.4% from image C because of clay loosening and dissolution/alteration (porosity analysis performed using Stream Software phase analysis). Images A and B are from sample depth 6757.6 ft. (2059.7 m) and images C and D are from sample depth 6,414.7 ft. (1,955.2 m). Qtz = quartz; K-spar = potassium feldspar; φ = porosity.
The Eau Claire Shale experiments indicate the possibility of some degree of chemical reactivity when exposed to supercritical CO2 at reservoir conditions; however, because the changes in pre- and post-reaction geochemistry and rock texture were so small, it was difficult to quantify the magnitude of this reactivity, the rate at which it was occurring and its effect on porosity, permeability, and overall competency of the Eau Claire shale to serve as a cap rock.
Task 5: Saline Groundwater Discharge from the Illinois Basin (Technical Leader: S. Panno)
We have completed sampling 43 separate springs and wells that were initially identified as “saline” or “mineral” springs within and along the margins of the Illinois Basin. Most of the chemical analyses are completed with the exception of 20 samples for neutron activation (Na, Cl, Br, I). In addition, we are awaiting stable isotope data (δD, δ18O, δ34S) for as many samples. We have found that it is possible to identify the source formation of the saline groundwaters using halide ratios and other chemical data. Geologic formations of origin range from Cambrian- through Pennsylvanian-age based on halide ratios and other indicators. Available stable isotope data show that most saline spring waters have mixed with relatively young groundwater; however, the data also show that some saline spring waters have mixed with Pleistocene-age melt waters and others have undergone extensive evaporation (Fig. 1).
Our results show that the saline seeps/springs of the Illinois Basin are coincident with geologic structures within the basin (faults, folds), and are coincident with the margins of the basin. It is clear that the saline seeps/springs within the Illinois Basin are following structural pathways along upward hydraulic gradients, and are discharging along the basin margins, particularly to the south (Fig. 2).
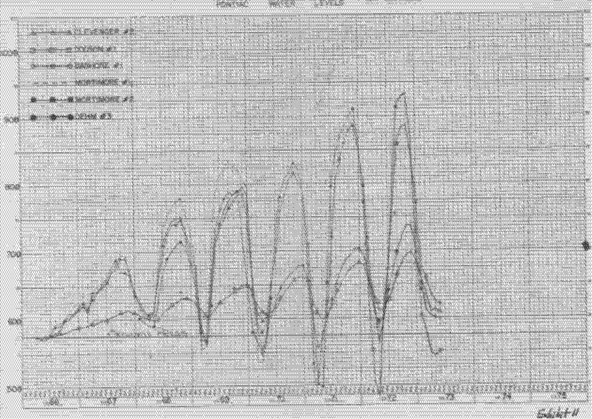
Figure 1. Delta Deuterium vs δ18O showing that most of the samples fall along the meteoric water line (MWL) and cluster with recent groundwater values. Some samples exhibit values indicative of recharge during colder climates (Pleistocene-age) and others fall along an evaporation line.
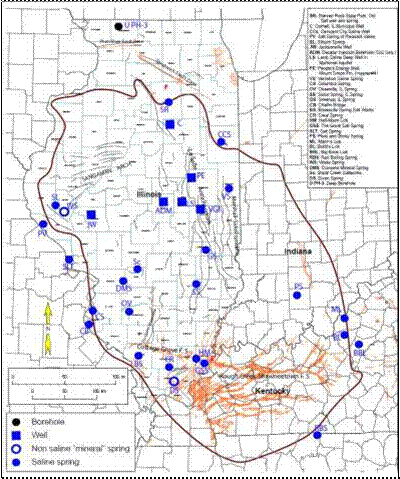
Figure 2. The Illinois Basin showing saline spring and well sample locations relative to geologic structures within the basin.
We continue to sample a private well that intersects the Mahomet Aquifer (MA) and a geologic structure that is discharging saline groundwater at the base of the MA resulting in an increase of chloride concentrations from about 1 mg/L to over 500 mg/L. This well is located about 15 miles from the Decatur site where CO2 is being injected as of November 2011, and the Cl- concentration appeared to increase just after CO2 injection began in November 2011 (arrow in Fig. 3).
Figure 3. Chloride concentration in private well tapping the MA and a geologic structure in Pennsylvanian-age bedrock. Red squares represent Cl- concentrations, blue diamonds indicate the start and stop of pumping of Decatur municipal wells (on two occasions) located over a mile from the private well, the arrow represents the time of the initiation of CO2 injection at the Decatur site.
The variation seen in the MA well (Fig. 3) appears to be out of phase with and therefore probably not affected by pumping of the nearby Decatur municipal wells nor the injection of CO2 at the Decatur site. However, having never observed chemical variations in deep wells like this, we plan to sample the MA well at least six more times on a monthly basis to determine whether this is natural variation or a systematic increase in Cl- concentrations over time.
Future Activities:
Task 1: Monitoring at Natural Gas Storage Sites (Technical Leader: E. Mehnert, ISGS)
In 2013, we plan to complete the following tasks:
- Work the TDS map through the internal ISGS review/publication process with publication in our state map series. This map will be useful as an initial condition for the basin-scale GCS model, as it represents the best available data for the location of the 10,000 mg/L TDS line (brine-freshwater boundary) within the Mt. Simon.
- Complete QA/QC for Crescent City storage field and analyze aquifer test data.
- Evaluate utility of derivative analysis for improving aquifer test analysis for available aquifer test data.
- Evaluate seasonal pressure changes to develop field-level estimates of transmissivity/hydraulic conductivity for the Pontiac storage field (see Fig. 2).
- Complete the synthesis of permeability data from various tests (core vs. field tests).
Task 2: Vertical Pressure Profiles for Monitoring CO2 and Brine Migration: Research and Validation of the Westbay System (Technical Leader: S. Benson)
- Conduct early-time water injection simulations on a large number of realizations for several geologic scenarios; attempt to reject geologic scenarios that are inconsistent with the observed (true) pressure response.
- For slightly longer time periods, run CO2 injection simulations on some representative realizations; again, attempt to reject geologic scenarios that are inconsistent with the observed (true) pressure response.
- Conduct inverse modeling (on a number of realizations) with the observed multilevel pressure measurements as input and a CO2 saturation map as the output, taking into account the uncertainty inherent in the problem.
- Conduct similar studies for (synthetic) leakage scenarios.
- To the extent possible, make a rough estimate of the ideal number and placement of pressure sensors.
References:
Caers, J. (2011), Modeling Uncertainty in the Earth Sciences, Wiley-Blackwell
Meyer, S.C., Wehrmann, H. A., H. V. Knapp, Y. -F. Lin, F. E. Glatfelter, J. R. Angel, J. F. Thomason, and D. A. Injerd, 2012. Northeastern Illinois Water Supply Planning Investigations: Opportunities and Challenges of Meeting Water Demand in Northeastern Illinois. Illinois State Water Survey Contract Report 2012-03, Prairie Research Institute, Champaign, IL, 261 p.
Journal Articles on this Report : 1 Displayed | Download in RIS Format
| Other project views: | All 52 publications | 6 publications in selected types | All 5 journal articles |
|---|
| Type | Citation | ||
|---|---|---|---|
|
|
Yoksoulian LE, Freiburg JT, Butler SK, Berger PM, Roy WR. Mineralogical alterations during laboratory-scale carbon sequestration experiments for the Illinois Basin. Energy Procedia 2013;37:5601-5611. |
R834382 (2012) R834382 (Final) |
Exit Exit |
Supplemental Keywords:
Characterization, carbon dioxide, leakage, pressure, monitoring springs, Mt. Simon Sandstone, Illinois Basin, multilevel pressure monitoringRelevant Websites:
Midwest Geological Sequestration Consortium Exit
THE UTILITY OF MULTILEVEL PRESSURE MEASUREMENTS IN MONITORING GEOLOGICALLY STORED CARBON DIOXIDE Exit (PDF)
Progress and Final Reports:
Original AbstractThe perspectives, information and conclusions conveyed in research project abstracts, progress reports, final reports, journal abstracts and journal publications convey the viewpoints of the principal investigator and may not represent the views and policies of ORD and EPA. Conclusions drawn by the principal investigators have not been reviewed by the Agency.